
This Bluesky post about early voting primary turnout in Texas from Brian Tyler Cohen has been making the rounds:
Why is this getting attention? Because Democrats are searching for data signals that Texas voters are shifting their way, and with a 25k primary-ballot advantage thus far, there’s something to look at.
If there is an actual shift in the electorate towards Democrats, this plays favorably for the Senate elections this November.
Like Texas, Georgia doesn’t require party registration. Both states record which party’s primary ballot a voter pulls: Democratic, Republican, or Non-Partisan.
GA-14’s special runoff has a single multiparty ballot, so we can’t do the same apples-to-apples primary comparison. But we can use each absentee voter’s last partisan primary on record as a partisan proxy and layer that onto early turnout, aggregating individual voters’ assumed preference rather than applying broad precinct-level percentages.
So, from Georgia’s data, what do we know (and not know)?
What we know
- 22,706 early votes cast (as of Feb 23), with each voter’s precinct and last partisan primary on record. That’s a real compositional signal, not a poll or a model.
- Cobb County is the only county where early voters lean Democratic. 46% of Cobb’s early voters last pulled a Democratic primary ballot vs. 42% Republican, producing a D+3.7% EV lean. At 5,361 early votes, it’s also the district’s largest early-vote county. Note that we’re only counting GA-14 precincts in Cobb, not the entire county.
- Every other county skews Republican by EV primary share, with Walker, Murray, and Chattooga each exceeding R+50% EV.
- Most precincts show a D-leaning swing vs. 2024 general margins, meaning the early electorate’s primary composition is less Republican than the 2024 actual vote. That could reflect differential enthusiasm, a shifting electorate, or both.
What we don’t know
- Conclusions drawn from early vote alone lack statistical validity. We’re looking at a partial dataset from a low-turnout special runoff. Patterns that appear meaningful now may not hold once the full electorate votes.
- How the ±X% voters break. Roughly 12% of early voters (EV share) have no partisan primary history or pulled a non-partisan ballot. In competitive precincts, that uncertainty is large enough to flip the lean entirely.
- Whether early voters represent Election Day voters. Early vote in a special runoff skews toward higher-propensity, more partisan voters. Election Day turnout could look very different.
- Whether primary history predicts 2026 vote choice. A voter who last pulled a Republican primary ballot in 2020 may not vote Republican in 2026. It’s a proxy, and an imperfect one, especially in a race with no party primary.
Open questions
- How does Election Day turnout by precinct compare in partisan composition to the early vote?
- Which precincts are campaigns targeting? Is either side overperforming its historical base?
- How many mail ballots have been requested but not yet returned, and where?
Note: primary history reflects who is voting early, not how they will vote. This is not a vote-share forecast.
Let’s look at the data…
Data as of 2026-02-23 · 22,706 total early votes · Source: GA Secretary of State
Important: Colors reflect each voter's last partisan primary on record —
not their 2024 vote and not a prediction of how they will vote.
A "blue" precinct means more early voters last voted in a Democratic primary;
a "red" precinct means more last voted in a Republican primary.
Source: GA SOS absentee file × GA voter history file (Oct 2024).
Civic Forge Solutions analysis.
Early Vote Summary by County
GA-14 Precincts Only — click a county row to expand precincts; click a precinct to zoom the map
| County / Precinct | Early Votes | Dem% | Rep% | No Data + N.P.% | EV Lean | 2024 Margin | Swing (pts) |
|---|---|---|---|---|---|---|---|
| ▶ Catoosa (11 precincts) | 2,924 | 23.0% | 65.9% | 11.1% | R+42.9% | R+45.5% | D+2.6 ± 11.1 |
| ▶ Chattooga (7 precincts) | 693 | 18.5% | 70.7% | 10.8% | R+52.2% | R+52.0% | R+0.2 ± 10.8 |
| ▶ Cobb (30 precincts) | 5,361 | 46.1% | 42.5% | 11.4% | D+3.7% | R+2.7% | D+6.4 ± 11.4 |
| ▶ Dade (7 precincts) | 552 | 21.0% | 69.0% | 10.0% | R+48.0% | R+57.1% | D+9.1 ± 10.0 |
| ▶ Floyd (19 precincts) | 3,288 | 37.3% | 47.4% | 15.2% | R+10.1% | R+32.9% | D+22.8 ± 15.2 |
| ▶ Murray (7 precincts) | 808 | 11.3% | 76.4% | 12.4% | R+65.1% | R+63.0% | R+2.1 ± 12.4 |
| ▶ Paulding (20 precincts) | 4,820 | 35.0% | 54.8% | 10.2% | R+19.8% | R+21.0% | D+1.2 ± 10.2 |
| ▶ Polk (7 precincts) | 1,336 | 28.9% | 64.3% | 6.8% | R+35.4% | R+54.3% | D+18.9 ± 6.8 |
| ▶ Walker (11 precincts) | 1,094 | 17.5% | 71.7% | 10.9% | R+54.2% | R+48.9% | R+5.3 ± 10.9 |
| ▶ Whitfield (23 precincts) | 1,830 | 28.2% | 51.6% | 20.2% | R+23.4% | R+32.2% | D+8.8 ± 20.2 |
| Total | 22,706 | 33.0% | 55.0% | 12.1% |
Dem% and Rep% are based on each voter's last partisan primary on record — not their 2024 vote choice. Voters with no primary history or non-partisan primaries are excluded from the lean calculation but included in the early vote totals.
Methodology
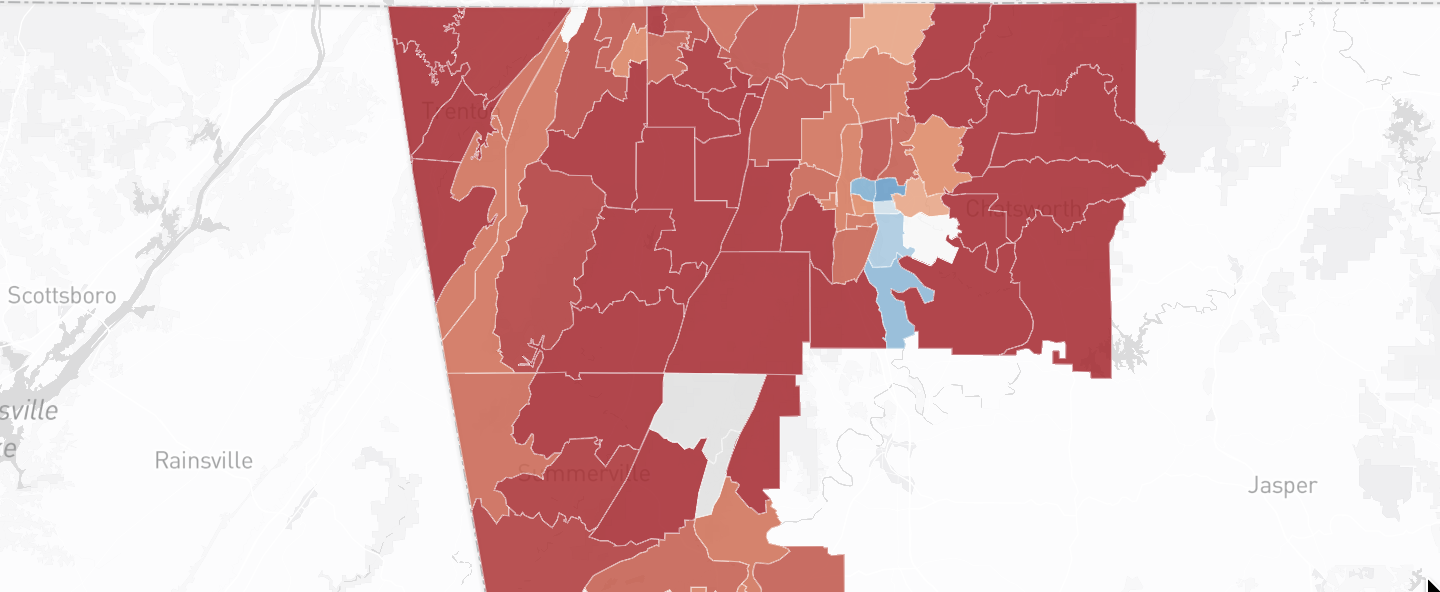
What this map shows: Each of the 142 precincts in Georgia’s 14th Congressional District is colored by the partisan composition of its 2026 early voters, based on each voter’s last partisan primary on record. This is not their 2024 general election vote, not an exit poll, and not a prediction of how they will vote in 2026. It is a measure of who is showing up to vote early, characterized by their primary history.
Data sources: Early voter list from the Georgia Secretary of State’s absentee ballot file (snapshot: February 23, 2026). Voter primary history from the GA SOS statewide voter history file (last updated October 2024). Precinct boundaries from the GA SOS 2024 precinct shapefile. 2024 CD-14 results from the GA SOS election results file.
Data collection and filtering: The GA SOS absentee file includes all voters across full counties, even where only part of a county falls within CD-14. To isolate only CD-14 voters, we filter to congressional_district = '014'. We also filter to ballot_status = 'A' (accepted ballots only), excluding any ballots that were requested but not returned, rejected, or cancelled. Finally, because the GA SOS file distributes the same voter across both per-county CSVs and a statewide CSV, we deduplicate by voter_registration_number before counting, keeping one record per voter. The query that produces the per-precinct counts is:
WITH deduped AS (
  SELECT
    voter_registration_number,
    county,
    county_precinct,
    ROW_NUMBER() OVER (
      PARTITION BY voter_registration_number
      ORDER BY ballot_return_date DESC
    ) AS rn
  FROM absentee_ballots_20260223
  WHERE congressional_district = '014'
    AND ballot_status = 'A'
)
SELECT
  ab.county,
  ab.county_precinct,
  COUNTIF(lp.normalized_party = 'Democrat')     AS dem,
  COUNTIF(lp.normalized_party = 'Republican')   AS rep,
  COUNTIF(lp.normalized_party = 'Non-Partisan') AS non_partisan,
  COUNTIF(lp.normalized_party IS NULL)           AS no_history,
  COUNT(*)                                       AS total_votes
FROM deduped ab
LEFT JOIN last_party_20241016 lp
  ON ab.voter_registration_number = lp.voter_registration
WHERE ab.rn = 1
GROUP BY ab.county, ab.county_precinct
The last_party_20241016 table contains each voter’s most recent partisan primary ballot as of October 2024, derived from the GA SOS statewide voter history file. The deduplication orders by ballot_return_date DESC, so in the rare case where a voter has more than one accepted CD-14 ballot on record, only the most recently returned one is counted.
Partisan lean calculation: EV Lean = Dem% minus Rep%, where percentages are calculated only among voters with a partisan primary history (Democrat or Republican). Voters with no primary history or a non-partisan primary are excluded from the lean calculation but are shown separately as the uncertainty margin. A positive value (blue) means more early voters last voted in a Democratic primary; negative (red) means more last voted in a Republican primary.
Precinct matching: 2026 absentee voter precincts are matched to 2024 precinct boundaries using a curated crosswalk. Two Chattooga County precincts (Subligna and Haywood) have no early voters yet and appear gray.
District boundaries: CD-14 as defined by the 2023 redistricting plan. Several counties are split; only precincts within CD-14 are included. Gordon County is not in CD-14 under the current district lines.