
Data in this article is as-of Wednesday, Feb 25th, 2026, reflecting ballots accepted through Tuesday, Feb 24th.
Interactive dashboard: Explore all of this data — including the timeline slider, daily ballot chart, partisan lean choropleth, swing simulator, and county summary table — on our GA-14 Data Dashboard.
Week 2 Gets Underway
After a strong opening week that saw over 20,000 ballots returned through Friday, the GA-14 early voting period entered its second week with a steadier pace. As of Tuesday, Feb 24, 28,132 ballots have now been accepted across the 10 counties in the district — 7.6% of total 2024 CD-14 general election votes, with nine days of early voting still remaining (through March 6).
The weekend and early Week 2 numbers tell the pacing story:
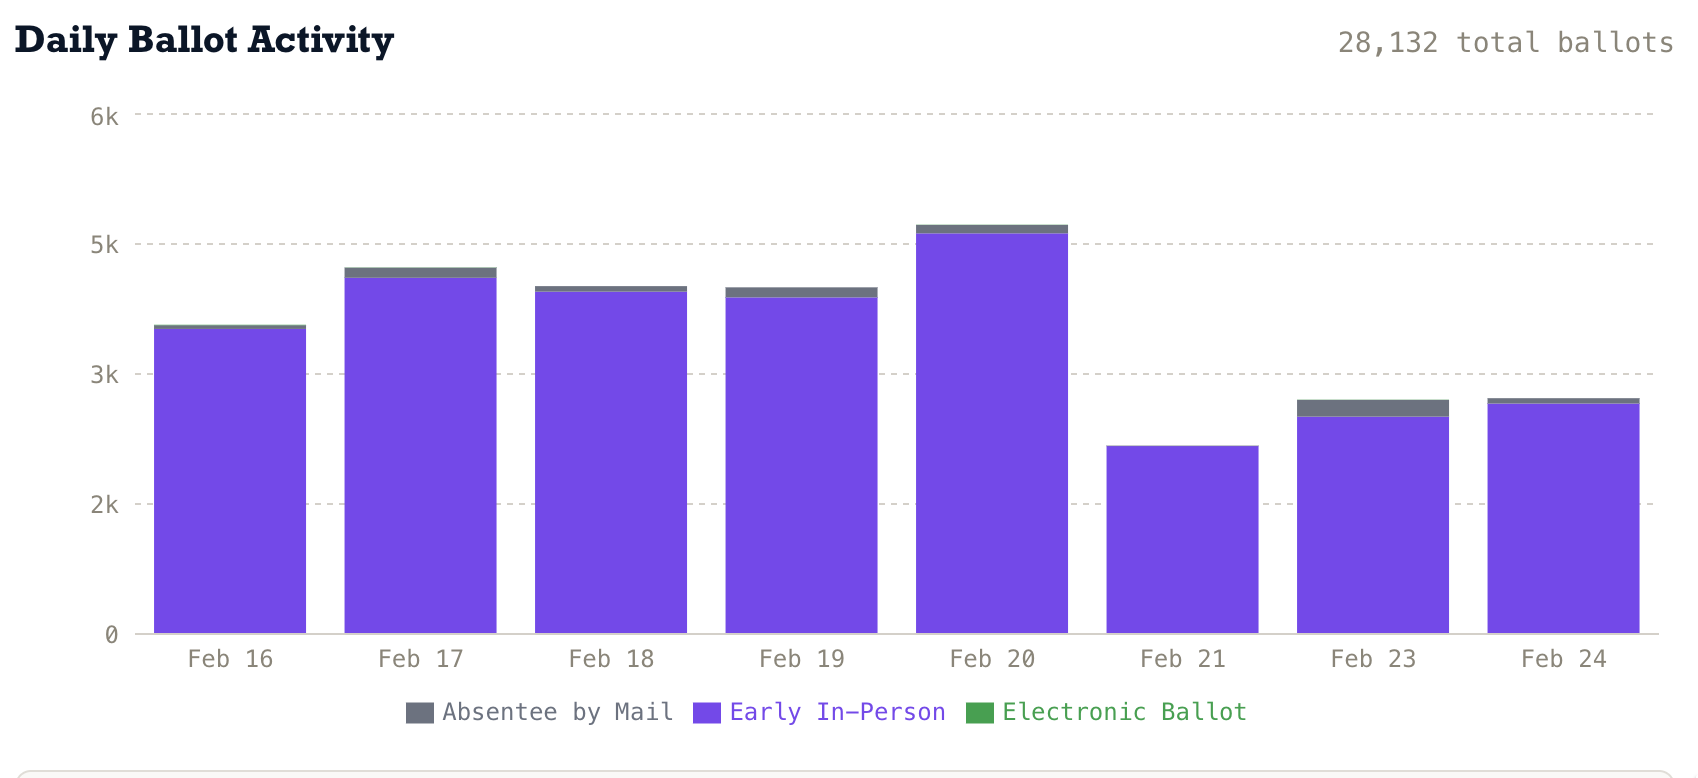
- Saturday, Feb 21: 2,175 ballots (Saturday hours are typically shorter)
- Monday, Feb 23: 2,702 ballots
- Tuesday, Feb 24: 2,721 ballots
Compare that to Week 1’s Monday-Tuesday: 3,547 and 4,228 (7,775 combined). Week 2’s Monday-Tuesday came in at 5,423 — about 70% of the Week 1 pace. This is expected - Georgia’s early voting typically sees a “curiosity surge” in the first few days as the most motivated voters turn out immediately, followed by a steadier middle period before another uptick in the final days.
Typically, the last week of voting comprises 30% to 50% of all EV ballots received.
Daily Ballot Activity
Turnout Forecast
As of Tuesday, Feb 24th, we estimate approximately 56,000 total early ballots will be submitted by close of early voting on March 6. That would represent about 19% of the 2024 general election early vote — a typical drop-off for a special election, though the absolute numbers remain substantial given the national attention on the contest.
The model maps each 2026 day to its structural equivalent in 2024 by week and day-of-week, then extrapolates from the observed pace. With 8 days of data, the estimate has stabilized in the 55K–59K range.
Where the Votes Are Coming From
Here’s the updated turnout composition table, comparing each county’s share of 2026 early votes to its share of 2024 general election votes:
| County | ’24 Margin | Share of ‘24 Vote | Share of ‘26 EV | Over/Under | ’26 EV Pace |
|---|---|---|---|---|---|
| Catoosa | R+45.5 | 9.2% | 12.7% | +3.5 | 10.4% |
| Chattooga | R+52.0 | 2.8% | 3.2% | +0.4 | 8.6% |
| Cobb | R+2.7 | 22.1% | 23.5% | +1.4 | 8.0% |
| Dade | R+57.1 | 2.1% | 2.5% | +0.4 | 8.9% |
| Floyd | R+32.9 | 11.7% | 14.4% | +2.7 | 9.3% |
| Murray | R+63.0 | 4.6% | 3.5% | −1.1 | 5.8% |
| Paulding | R+21.0 | 23.5% | 21.1% | −2.4 | 6.8% |
| Polk | R+54.3 | 5.0% | 6.1% | +1.0 | 9.1% |
| Walker | R+48.9 | 8.4% | 4.9% | −3.5 | 4.4% |
| Whitfield | R+32.2 | 10.4% | 8.1% | −2.3 | 5.9% |
‘26 EV Pace is 2026 early votes as a percentage of each county’s total 2024 CD-14 vote — a measure of how far along each county is relative to its 2024 baseline, not a true turnout rate. Over/Under is the gap between the county’s share of 2026 EV and its share of 2024 total vote.
Analysis
- Catoosa (+3.5) continues to be the biggest over-indexer. At a 10.4% EV pace, Catoosa voters are showing up at a higher clip than any other county. This is a deep-red county (R+45.5 in 2024), so this over-representation helps Republicans.
- Floyd (+2.7) is also over-indexing, running a 9.3% EV pace. Floyd is the district’s third-largest county and went R+32.9 in 2024.
- Walker (−3.5) remains the biggest under-indexer, with just a 4.4% EV pace — less than half of Catoosa’s. The low early vote activity in Walker (R+48.9 in 2024) partially offsets Catoosa’s and Floyd’s Republican-leaning over-representation.
- Paulding (−2.4), the district’s second-largest county, is under-indexing. Its 6.8% EV pace trails the district average. Since Paulding was R+21 in 2024 (competitive by CD-14 standards), its lower-than-expected turnout has a small net effect on the partisan composition.
- Cobb (+1.4) continues to track slightly above its 2024 share. As the most competitive county in the district (R+2.7), Cobb’s over-representation is structurally favorable for Democrats.
Net effect: The mix of over- and under-indexing counties somewhat offsets each other. Republican-leaning Catoosa and Floyd are over-represented, but so is swing-county Cobb. Republican-leaning Walker and Paulding are under-represented. The overall compositional impact is roughly neutral compared to 2024 proportions.
Partisan Lean of Early Voters
Using each voter’s last partisan primary participation as a proxy for partisan ID, the current early vote pool breaks down:
- Republican primary voters: 15,778 (56.1%)
- Democratic primary voters: 8,956 (31.8%)
- No partisan primary history: 3,000 (10.7%)
- Non-partisan: 398 (1.4%)
Using the no partisan primary history as a proxy for error rate, past partisan lean of EV voters clearly indicates a strong Republican partisan preference. This means that in a runoff, if the top two vote-getters are a Republican and a Democrat, there are strong headwinds against a Democratic victory.
Remember: partisan primary history is a directional indicator, not a prediction. Voters who last pulled a Republican primary ballot may vote for the Democratic candidate in this special election, and vice versa.
Explore the geographic distribution of partisan lean across GA-14’s precincts on our interactive choropleth map. Each precinct is colored by the share of its early voters with Democratic vs. Republican primary history:
Swing Simulator
The swing simulator applies each precinct’s 2024 congressional two-party vote shares (Greene vs Harris) to its current early vote count, producing a precinct-weighted estimated margin of R+27.8 across the district. Use the slider to model uniform swing scenarios:
- A D+5 swing brings the margin to roughly R+18 — still a comfortable Republican hold
- A D+10 swing brings it to ~R+8 — competitive but still Republican
- A D+15 swing is the approximate breakeven threshold
What to Watch This Week
With nine days of early voting remaining, here’s what we’re tracking:
- Pace sustainability: Week 2 is running at ~2,700/day. If it holds, expect 50,000+ total early ballots. A dropoff below 2,000/day would suggest the “enthusiasm gap” is widening between opening-week motivations and sustained engagement.
- Walker and Whitfield: These two counties are significantly under-indexing relative to 2024. Combined, they account for 13.0% of early votes but 18.8% of 2024 votes, a 5.8-point gap. If these Republican-leaning counties surge in the final days, the compositional picture shifts right.
- Saturday and Sunday voting: This Saturday (Feb 28) will be the second Saturday of early voting. The first Saturday drew 2,175 voters. Higher Saturday turnout often correlates with voters who can’t make weekday hours — a different demographic slice. There is also one Sunday for early voting on March 1st.
Questions? Get in touch at [email protected].
Civic Forge Solutions provides civic technology and data analysis services for progressive and Democratic candidates, campaigns, and committees. Based in Atlanta, Georgia.